
Since 1990, average childcare costs in the U.S. have more than doubled while the median household income has increased by just 35%. With childcare costs outpacing incomes, childcare alone can account for more than 10% of one’s pre-tax income. However, in some states childcare is more affordable than others.
In this study, SmartAsset looked at the best states for childcare, taking into account both affordability and access. We considered six metrics to calculate our ranking: average childcare costs compared to median household income, daycare facilities per 10,000 establishments, childcare workers per 1,000 workers, recent childcare disruption frequency, percentage of eligible children enrolled in Head Start and the ratio of young children to all childcare workers. For more information on our data sources and how we put the information together to create the final rankings, read our Data and Methodology section below.
Key Findings
- Childcare costs relative to incomes vary widely by state. Residents in Alabama pay an average of just 10.36% of their annual household income on childcare costs, the lowest in our study. In stark contrast, average childcare costs make up more than 22% of the median household income in Washington, D.C.
- In four states, more than half of households reported recent childcare disruptions. Data from the Census Bureau’s Household Pulse Survey shows that nationally 37.9% of adults in households with children younger than five faced recent childcare disruptions. The rates are significantly higher in these four states: New Jersey (54.3%), Rhode Island (54.2%), New Mexico (53.2%) and Virginia (52%).
- Eight states in the top 10 have a child-to-staff ratio below 40. Comparing the number of children ages five and younger to childcare workers, North Dakota has the lowest (and best) child-to-staff ratio of 20.4 while Washington has the highest (and worst) ratio of 103.6. Across our top 10, Mississippi and Oklahoma are the only states with a ratio exceeding 40.
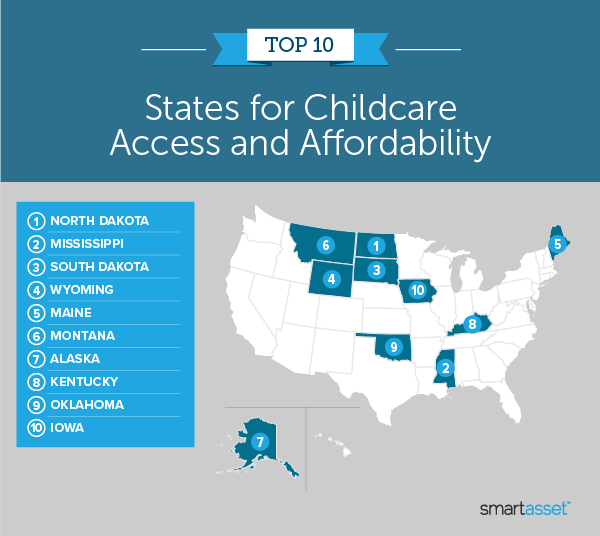
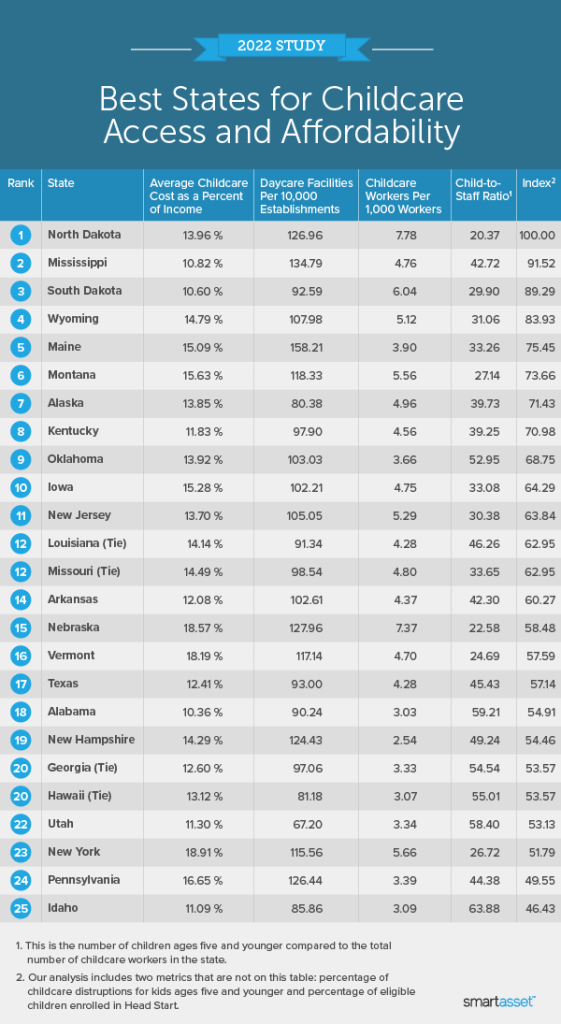
1. North Dakota
This Midwestern state ranks first in three of the six metrics we analyzed: childcare workers per 1,000 workers (7.8), child-to-staff ratio (20.4) and the percent of eligible children funded by Head Start (61.3%). North Dakota ranks 16th-best when comparing the average cost of childcare to the state’s median household income (14%).
2. Mississippi
Mississippi is first of three Southern states to make the top 10 in our study. This state also ranks in the top 10 across four metrics: it ranks third-best for its low average cost of childcare compared to the median household income (10.8%), second-highest for the number of daycare facilities per 10,000 establishments (134.8), seventh-highest for the percent of eligible children funded by Head Start (42.4%) and 10th-highest for the number of childcare workers per 1,000 workers (4.8).
3. South Dakota
Parents in South Dakota can expect average childcare costs to amount to less than 11% of median household income (the No. 2 rate in our study). This state also ranks in the top 10 for three other metrics: second-highest for the number of childcare workers per 1,000 workers (6), fifth-highest for the percent of eligible children funded by Head Start (46.3%) and seventh-best for the child-to-staff ratio (29.9).
4. Wyoming
The Western state to rank highest in the top 10, Wyoming also ranks in the top 10 across four of the metrics we analyzed: seventh-highest for the number of childcare workers per 1,000 workers (5.1), fifth-best for percent of households reporting childcare disruptions for children younger than five (23.3%), eighth-highest for the percent of eligible children funded by Head Start (40.4%) and ninth-best for the child-to-staff ratio (31.1).
5. Maine
The only Northeastern state in the top 10 is Maine. Across all six metrics, the state’s strongest showing is in the number of daycare facilities per 10,000 establishments (158.2) where it ranks first. Another metric that Maine ranks high for is the low percentage of households reporting childcare disruptions for children younger than five (30.9%) in which it ranks 10th-best. When comparing childcare costs to the median household income, Maine residents can expect about 15% of their income to go to childcare.
6. Montana
Montana ranks second-highest for the percent of eligible children funded by Head Start (54.2%), fifth-highest for the number of childcare workers per 1,000 workers (5.6), fifth-best for the child-to-staff ratio (27.1) and 10th-highest for the number of daycare facilities per 10,000 establishments (118.3). Montana residents can expect to pay 15.6% of their median household income for childcare costs.
7. Alaska
This Western state known for its low population density ranks in the top 10 for the number of childcare workers per 1,000 workers (eighth-highest) and the percentage of eligible children funded by Head Start (ninth-highest). In Alaska, there are five childcare workers per 1,000 workers and 39.8% of the eligible children in this state are enrolled in Head Start. One metric Alaska did not excel in is the number of daycare facilities per 10,000 establishments (80.4), ranking 45th-worst overall.
8. Kentucky
Residents in Kentucky can expect 11.8% of their median household income to account for childcare costs, the seventh-lowest rate in our study. There are three other metrics where Kentucky ranks in the top 20: 13th-highest for the number of childcare workers per 1,000 workers, 17th-best for the child-to-staff ratio (39.3) and 19th-best for the percent of households reporting childcare disruptions for children younger than five (33%).
9. Oklahoma
The final Southern state in our top 10 is Oklahoma. The percentage of households reporting childcare disruptions for children younger than five is 30.2%, a top 10 rank in our study. Additionally, 32% of eligible children are enrolled in Head Start, the 12th-highest percentage in our study. Residents in Oklahoma can expect 13.9% of their household income to go to childcare costs which ranks 15th-best.
10. Iowa
Iowa is the last state in our top 10. It also ranks 10th-best for its child-to-staff ratio (33.1). For the remaining metrics we analyzed, Iowa ranks in the top 15 for two of them: 11th-highest for the number of childcare workers per 1,000 workers (4.8) and 13th-best for the percent of households reporting childcare disruptions for children younger than five (31.9%).
Data and Methodology
To find the states with the best childcare, SmartAsset looked at data for all 50 states and the District of Columbia. We compared them across six metrics:
- Average cost of childcare as a percentage of median household income. Data comes from the Economic Policy Institute and Census Bureau’s 2020 1-year American Community Survey.
- Daycare facilities per 10,000 establishments. Data comes from the Census Bureau’s 2019 Business Patterns Survey.
- Childcare workers per 1,000 workers. Data comes from the Bureau of Labor Statistics’ 2020 Occupational Employment and Wage Statistics.
- Recent childcare disruption frequency. Percentage of adults in households where children younger than five were unable to attend daycare or another childcare arrangement in the last 4 weeks. Data comes from the Census Bureau’s Household Pulse Survey. Respondents were surveyed from December 29, 2021 through January 10, 2022.
- Percentage of eligible children enrolled in Head Start. This is the percentage of children ages five and younger enrolled in Head Start compared to the number of children ages five and younger living below the poverty line. Data comes from the Department of Health & Human Services and Census Bureau’s 1-year 2019 American Community Survey.
- Child-to-staff ratio. This is the number of children ages five and younger compared to the number of childcare workers. Data comes from the Census Bureau’s 2020 1-year American Community Survey and the Bureau of Labor Statistics’ 2020 Occupational Employment and Wage Statistics.
We ranked each state in every metric, giving a double weight to the metric average childcare cost as a percentage of median household income. We gave a full weight to all other metrics. Using those rankings, we found each state’s average ranking and used the average to determine a final score. The state with the highest average ranking received a score of 100, ranking as the state with the best childcare. The state with the lowest average ranking received a score of 0, ranking as the state with the worst childcare.
Tips for Managing Childcare Needs
- Set up a budget. Juggling several of life’s expenses can be tricky, but you can gain financial control with budgeting. Our budget calculator can give you a clear picture of your current spending but also visualize the next six months and show you where cutting back on excess expenses can maximize your savings.
- Explore ways to put money aside. According to Brigida Aversa, Chief Operating Officer and Co-founder of Tiny Hoppers, “A dependent care FSA allows you to put aside up to $5,000 of pretax income per year in an account that can be used to pay for eligible work-related child care expenses.” Along with reducing your tax burden, FSA money can be used for expenses such as babysitting, before and after school programs, and nannies among other childcare-related costs.
- Work with a professional. If you find yourself struggling day to day and need extra support, SmartAsset’s free tool makes it easy to get connected with local advisors in as little as five minutes. A financial advisor can help you make the most of your money. If you’re ready to find an advisor who can help you achieve your financial goals, get started now.
Questions about our study? Contact press@smartasset.com.
Photo credit: © iStock/FatCamera